CPU profiling
Introduction
CPU-intensive operations have a major impact on Node.js applications stability and response timings. Server-side rendering is exactly such a main CPU-intensive task in the tramvai applications. SSR mainly consists of rendering React application to HTML string and in a smaller degree global store initial state serialization, and both of this operations are synhronious.
For the most part, it is the rendering time to HTML string that limits the throughput of our application, the actual RPS and directly affects the response timings. Because of that, it is very important to perform load testing and profiling of rendering bottlenecks of our SSR applications. This guide will be focused on profiling, for load testing you can use such a great tools as autocannon and k6.
Profiling
Running the application
Run server manually
Use this recipe for any server performance tests, results will be more stable than with start-prod command
Before, you need to made a production build:
tramvai build <appName>
After, with default options, application server bundle will be placed here - dist/server/server.js, and client code in dist/client directory.
Use this command to run application server:
DANGEROUS_UNSAFE_ENV_FILES='true' DEV_STATIC='true' ASSETS_PREFIX='http://localhost:4000/dist/client/' node --inspect dist/server/server.js
About env variables:
DANGEROUS_UNSAFE_ENV_FILESforce server to read env variables fromenv.development.jsDEV_STATICforce server to run static server on4000port (all folders from current directory will be served)ASSETS_PREFIXpoints to client code folder on static server
Run start-prod command
Fastest way to run production server, but not suitable for performance tests due to inaccuracies
To debug the production version of the application, the tramvai start-prod <appName> command with the --debug flag is used.
⌛ Run the application:
tramvai start-prod <appName> --debug
After finishing the build and running the application, you will see a log like this: Debugger listening on ws://127.0.0.1:9229/356818ba-fa02-4484-82b3-76b1d57bbd7e
Connecting DevTools
⌛ Open chrome://inspect url in browser
You will see a tab with connected application:
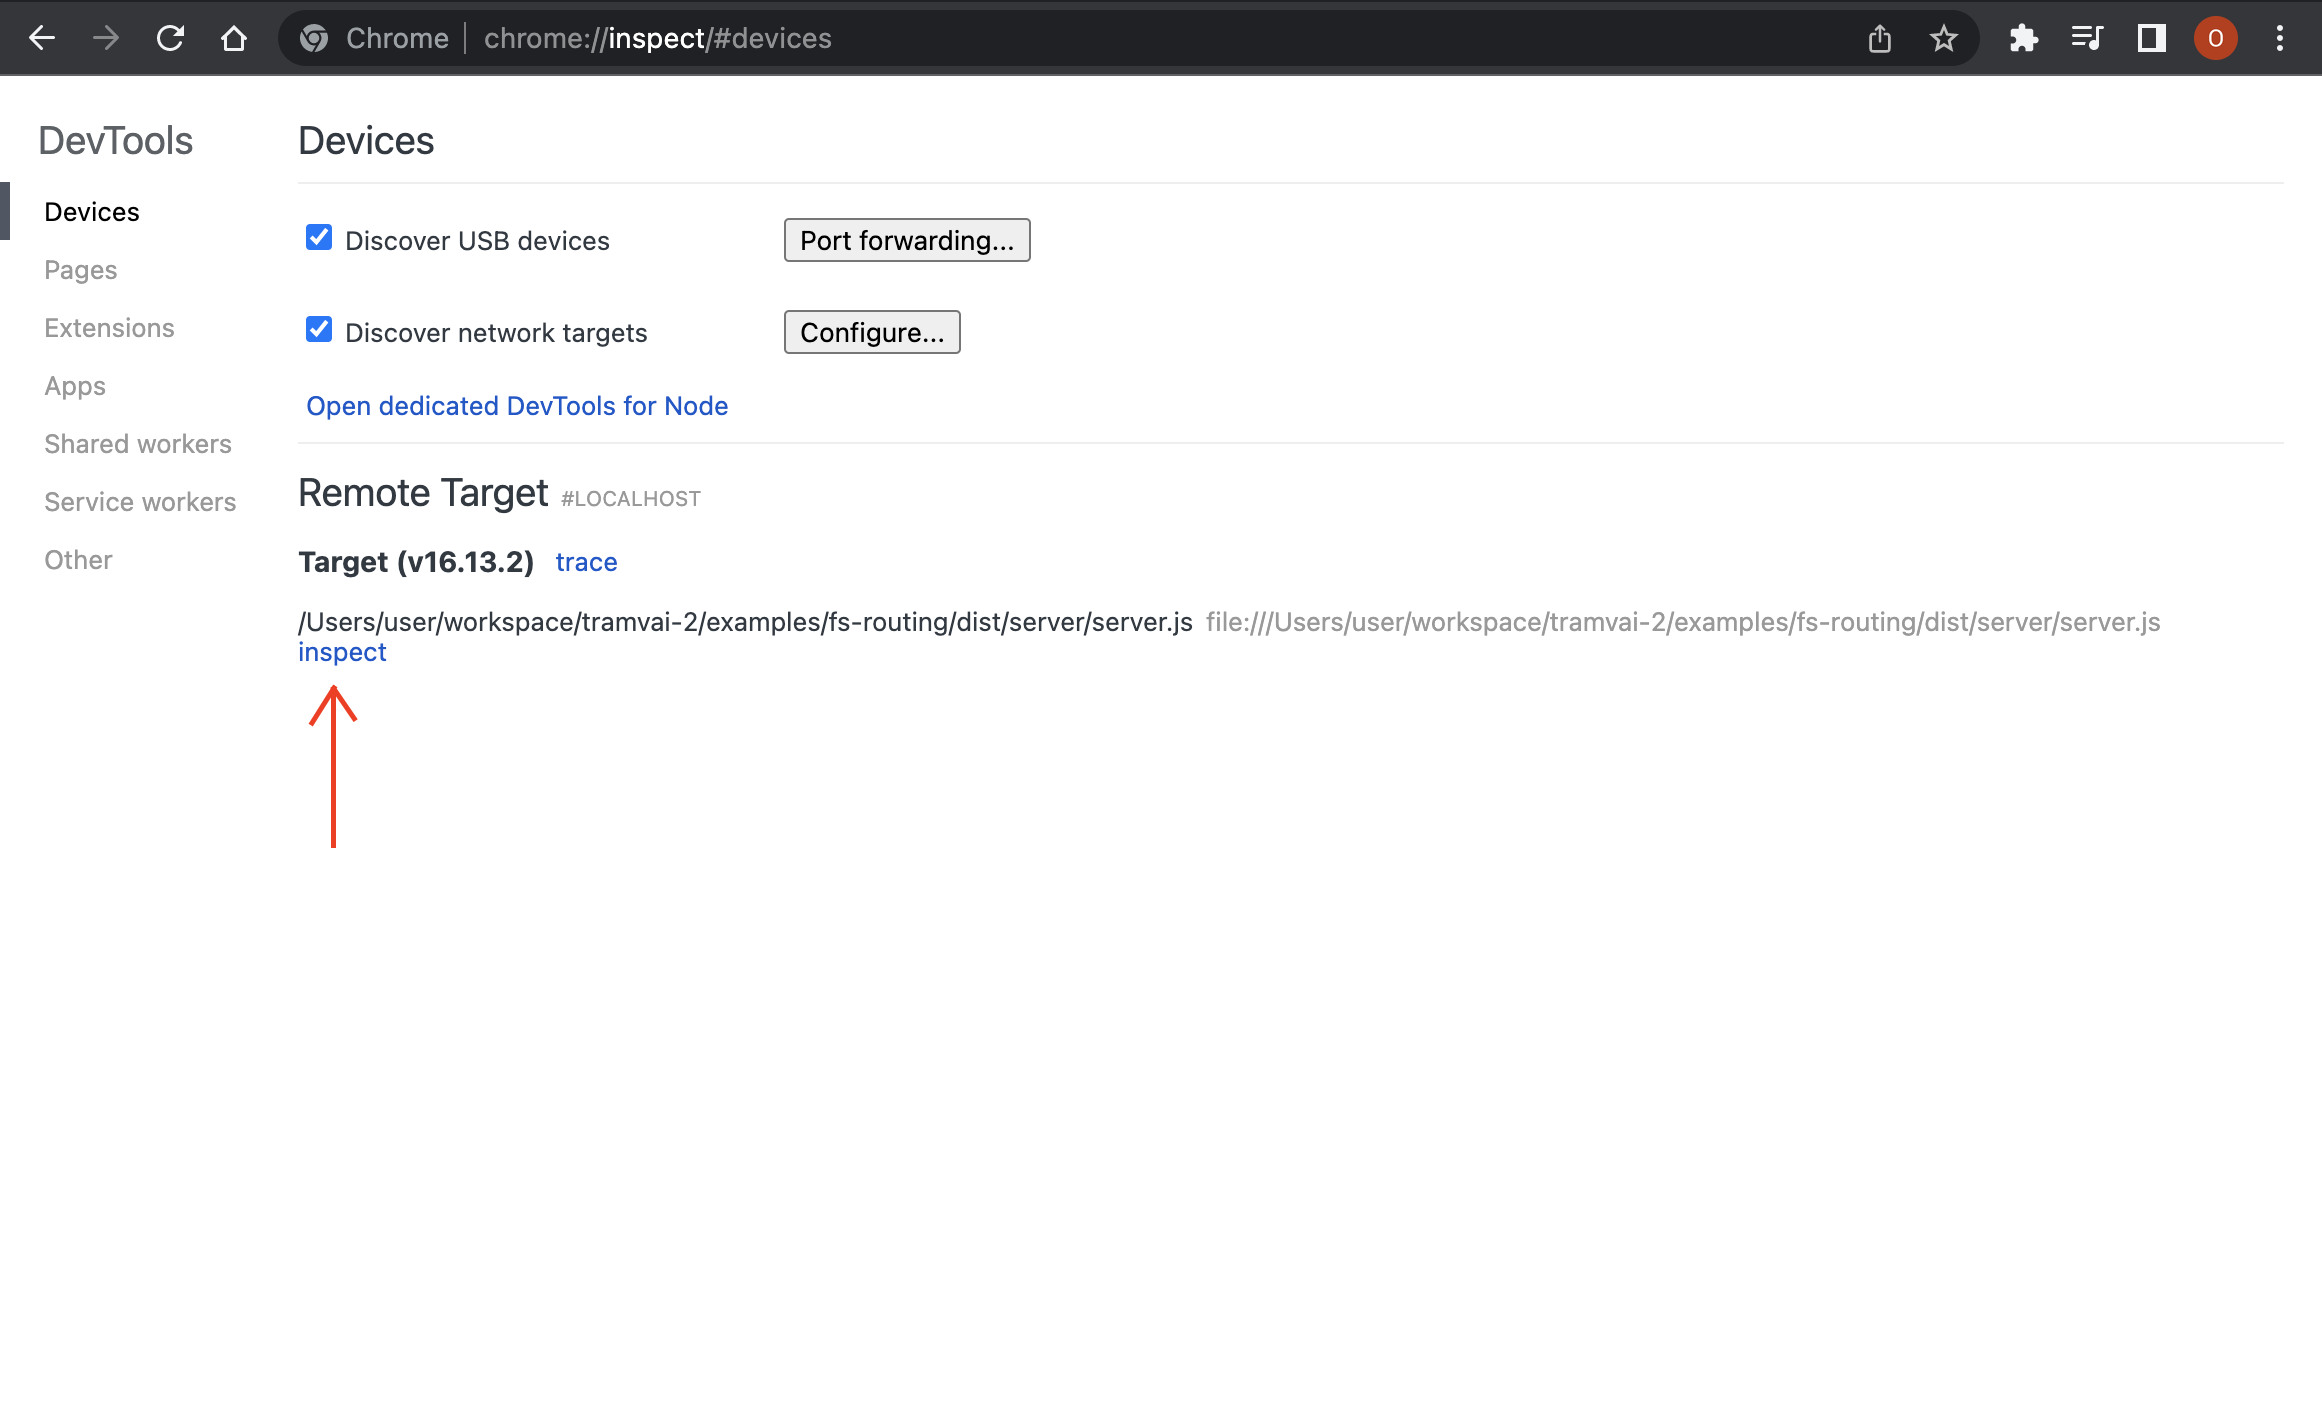
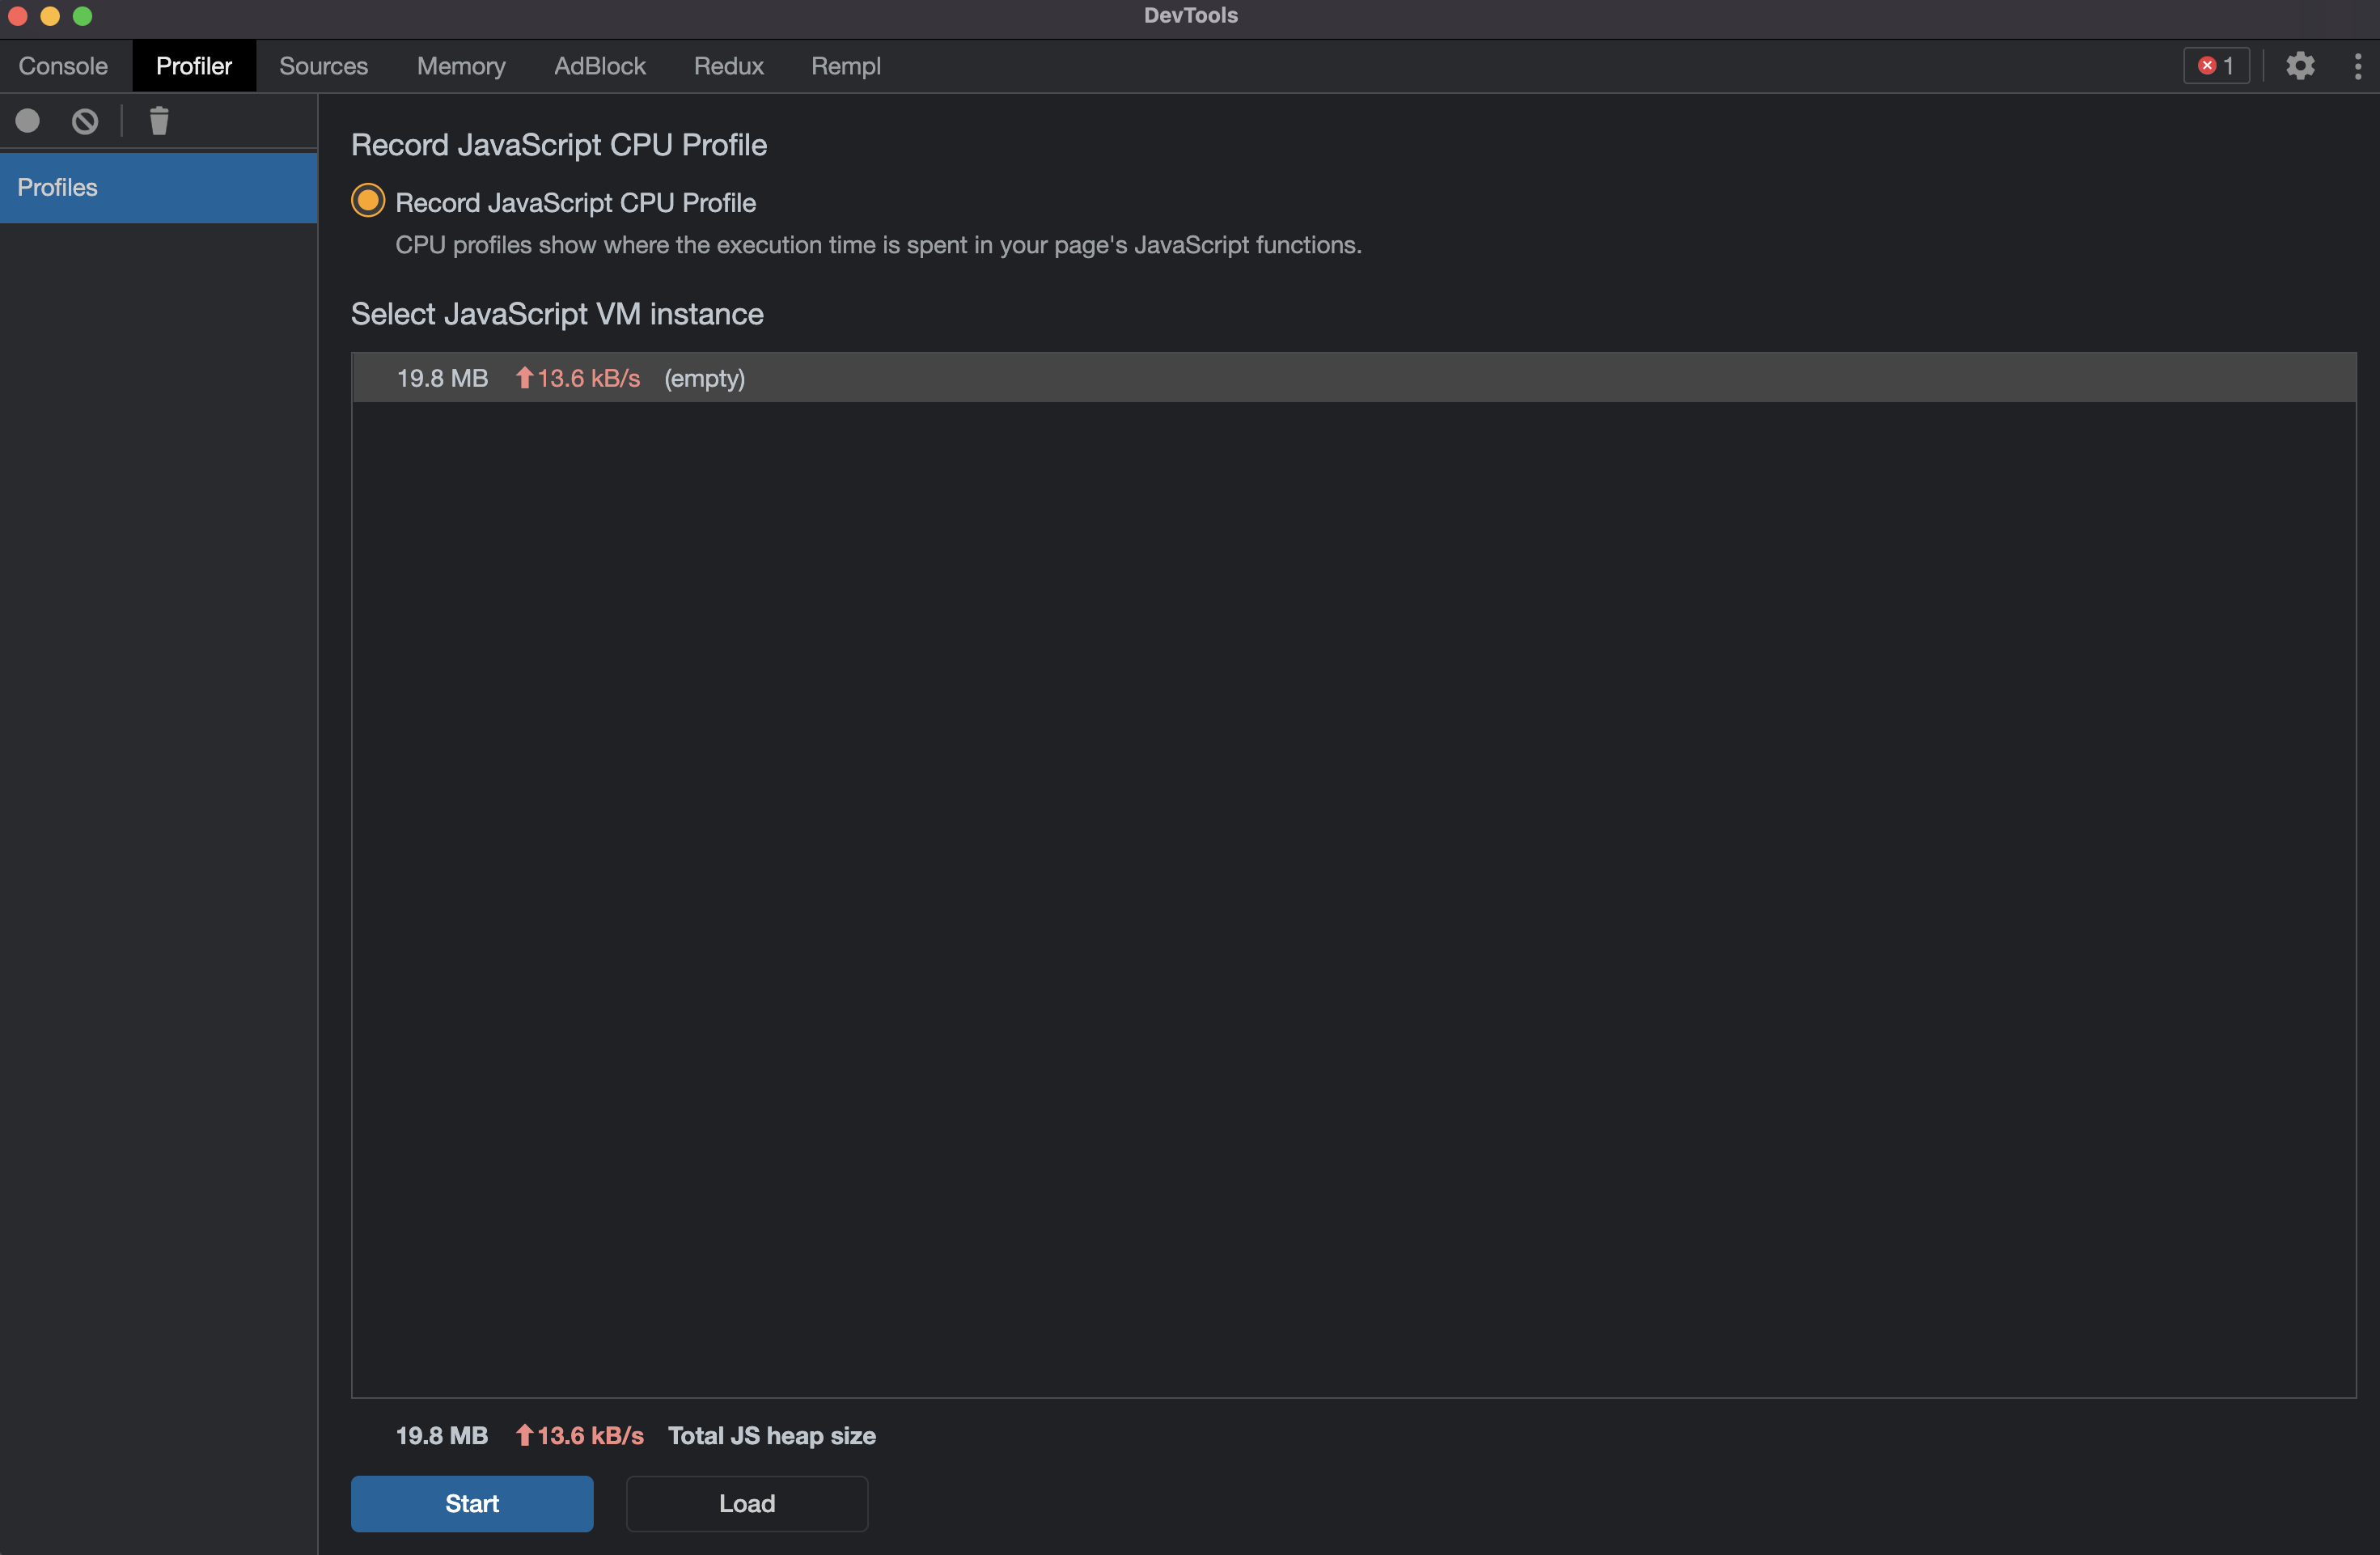
⌛ Press inspect button
The DevTools tab will open:
Profiling methodology
At first, select specific page for profiling, for example
/foo/routeAfter running the application, it is worth warming up caches for selected page.
⌛ Run
curlonce:curl http://localhost:3000/foo/Then, we need to start profiling.
⌛ Press
startbutton in DevTools tabAfter profiling started, send several requests per page, with short intervals.
⌛ Run
curlmultiple times:curl http://localhost:3000/foo/
# wait 2 seconds
curl http://localhost:3000/foo/
# wait 2 seconds
curl http://localhost:3000/foo/And we need to finish profiling
⌛ Press
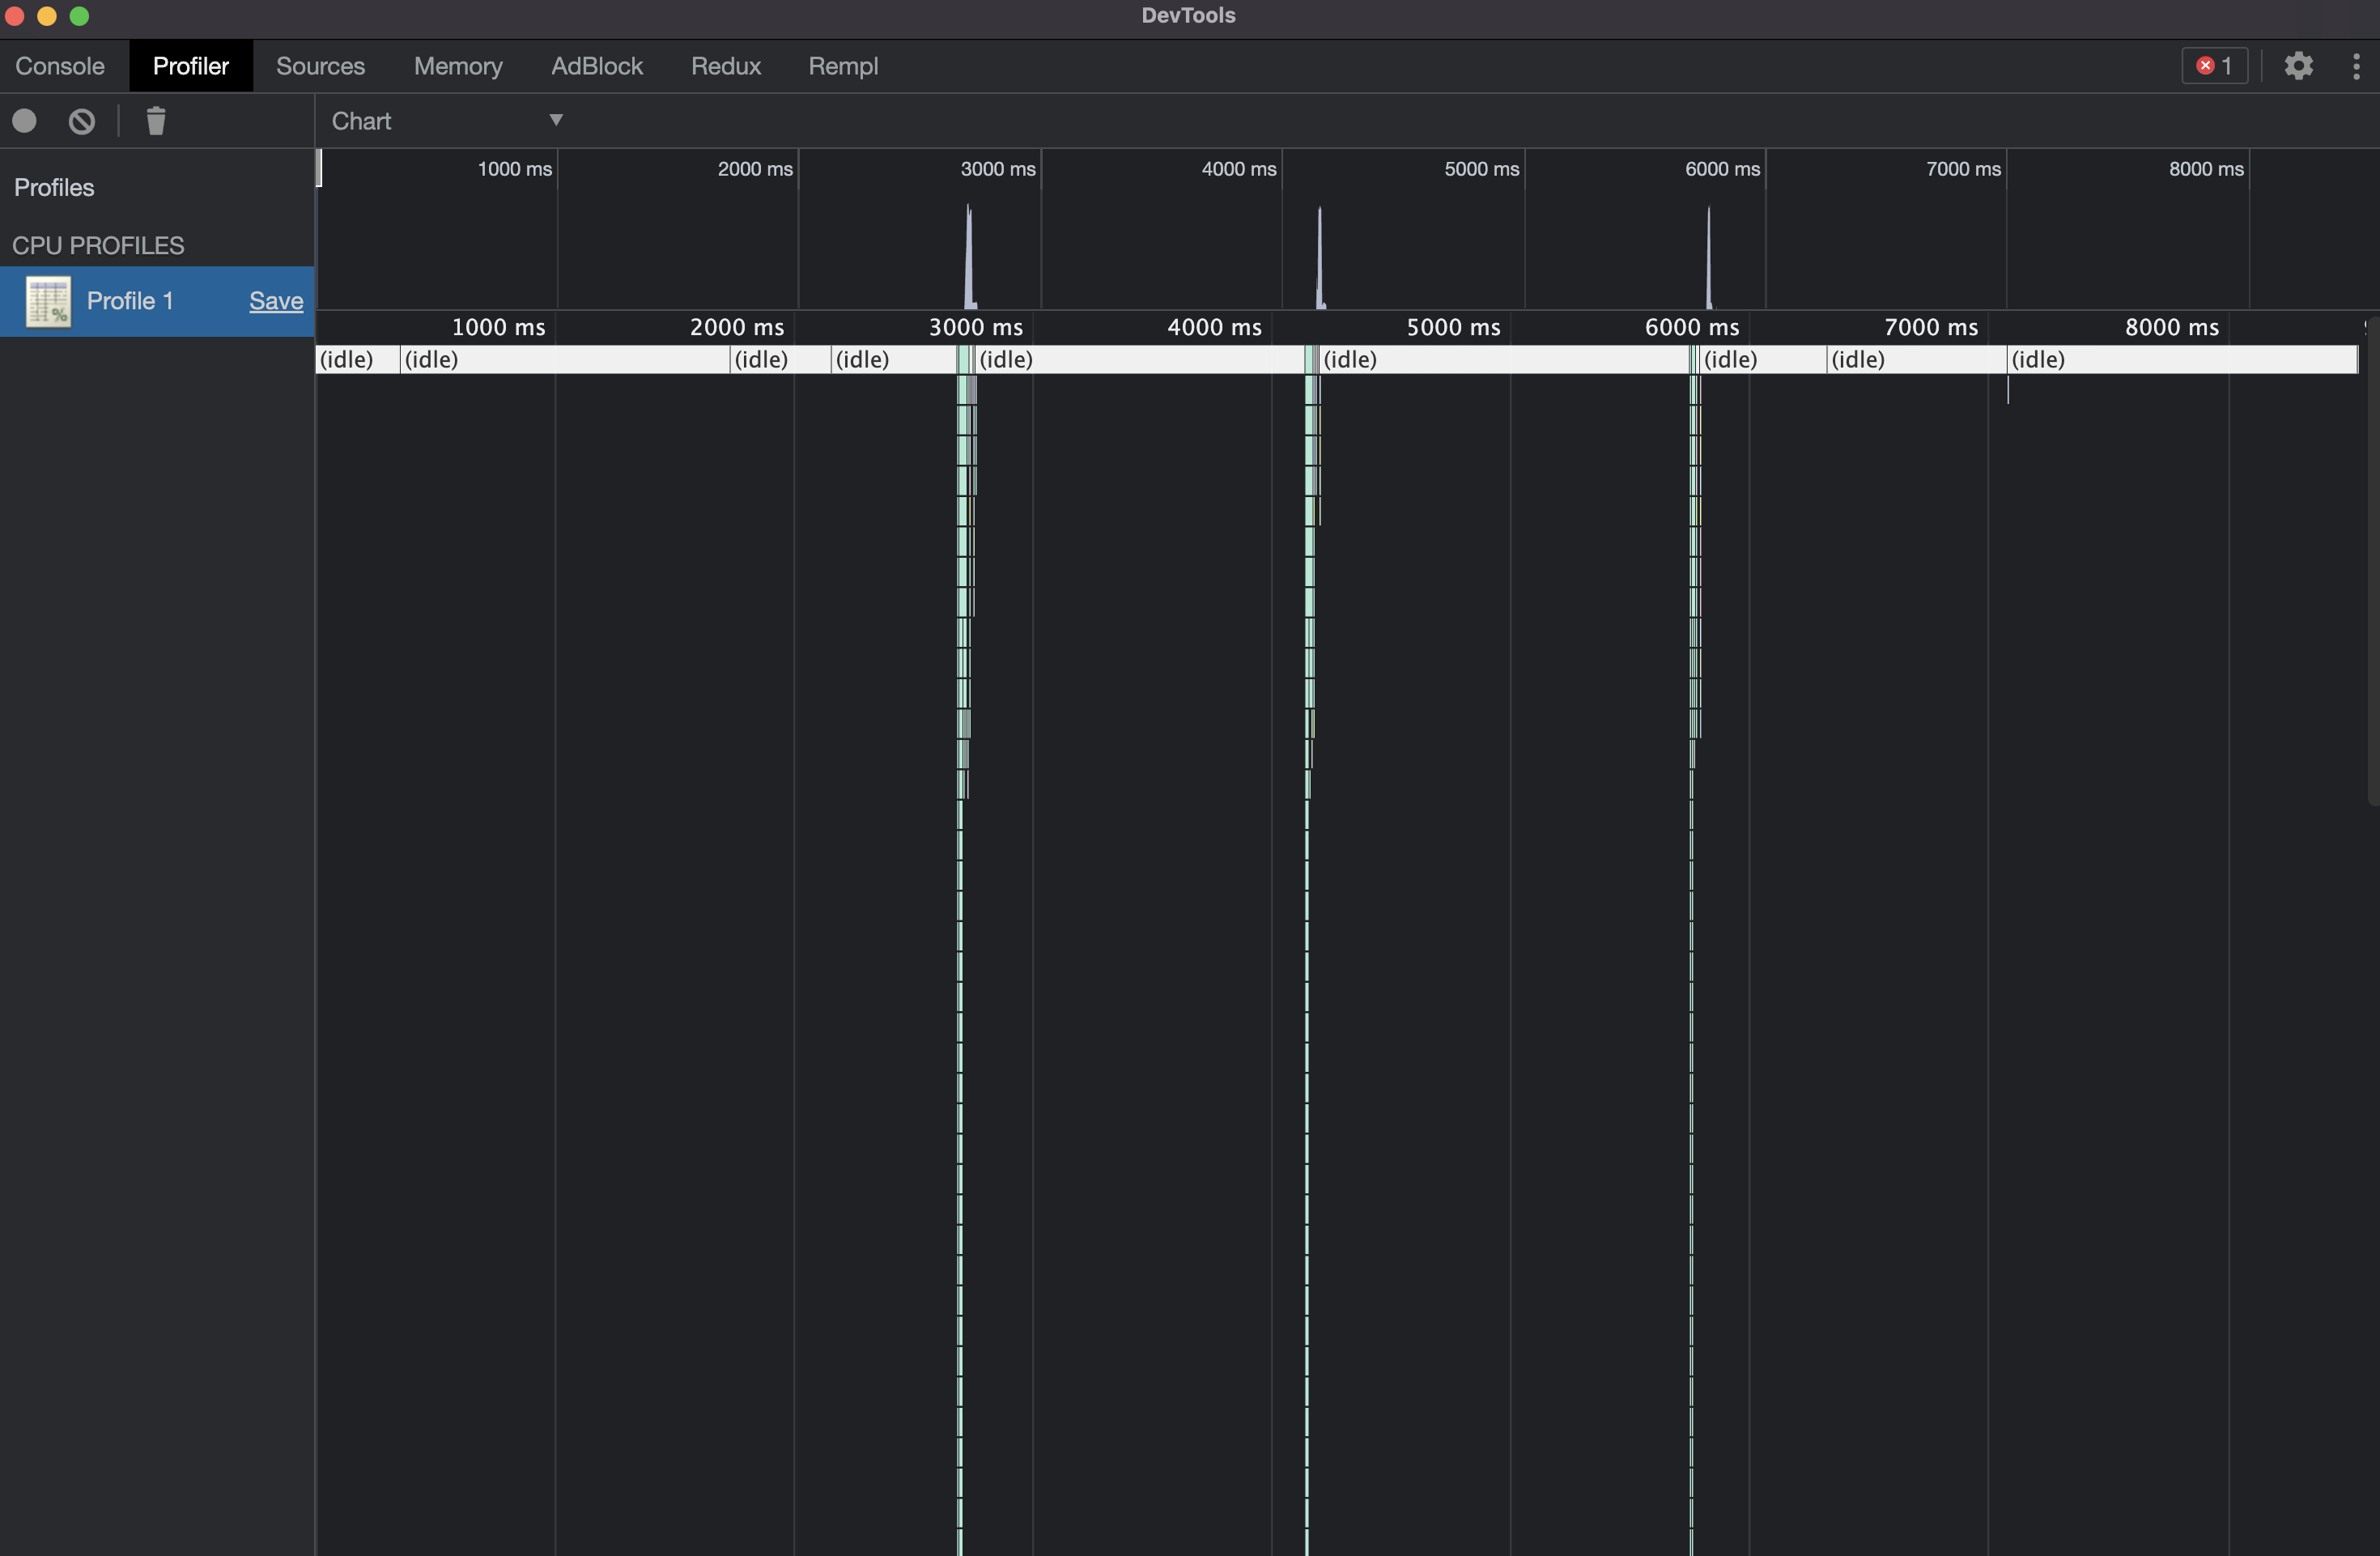
stopbutton in DevTools
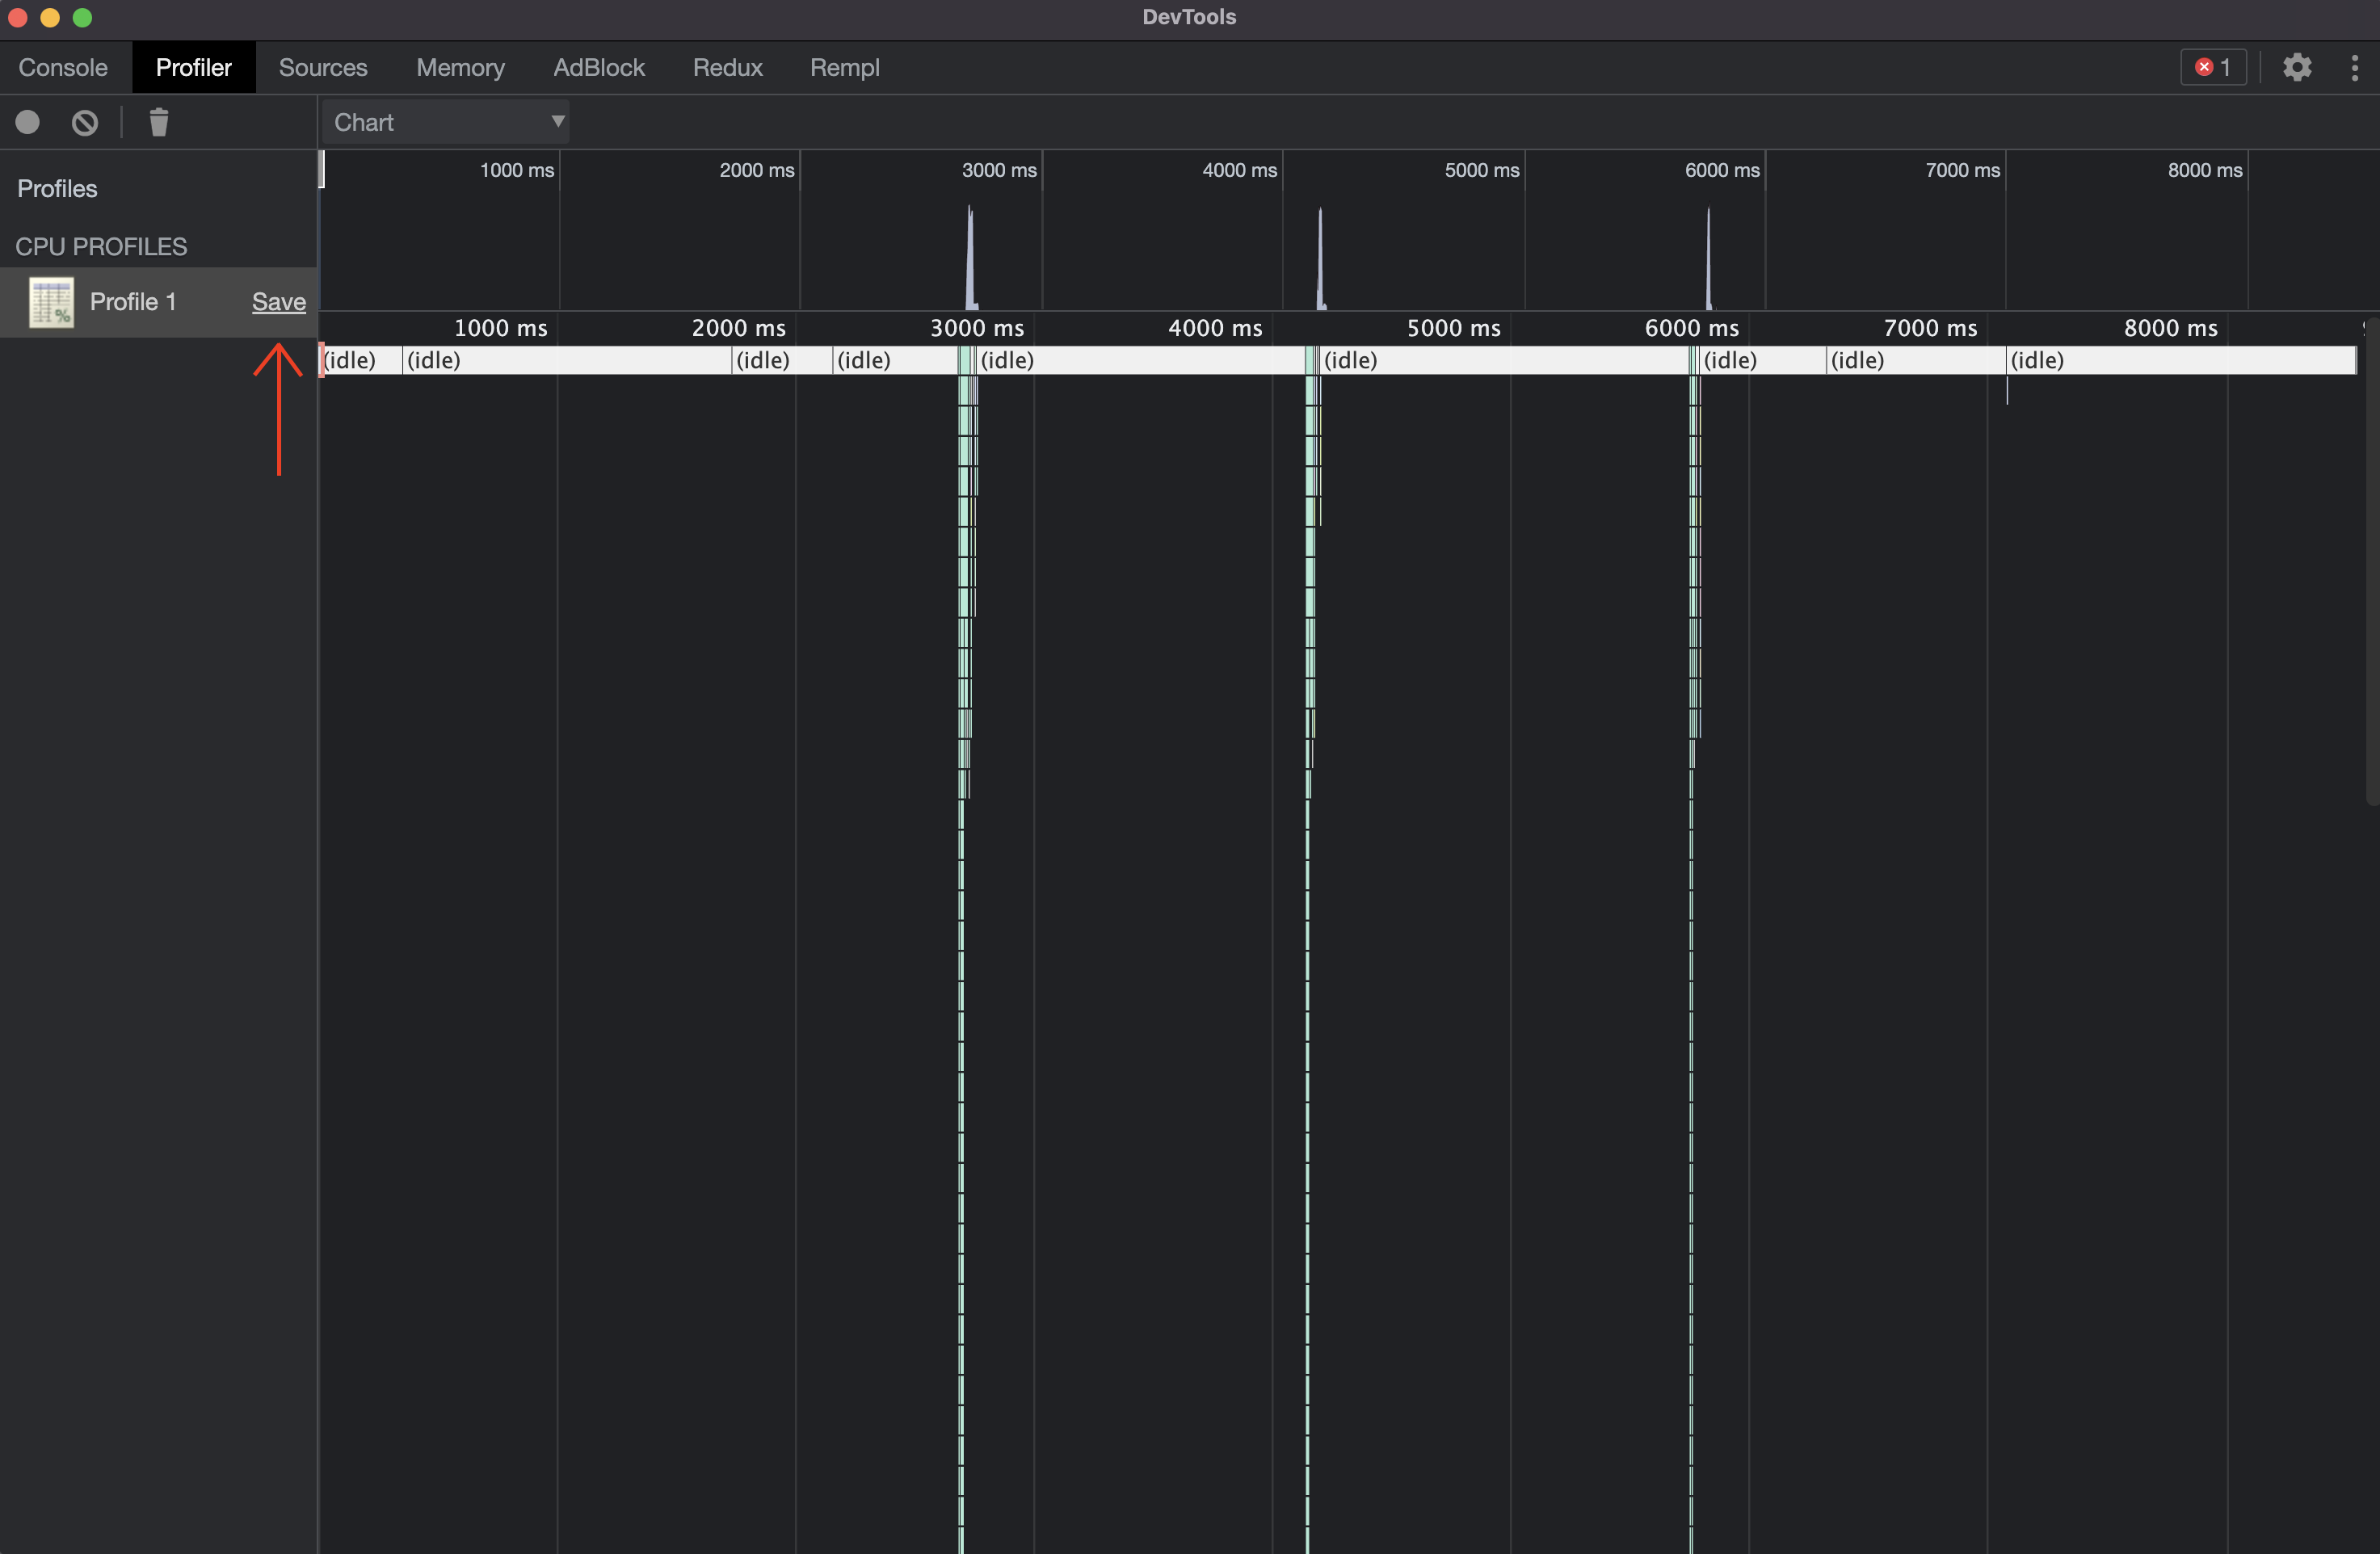
After all steps, you will see a Chart with this requests:
How to inspect CPU profile files with CPUpro
One more way to inspect CPU profile files is cpupro - a special tool for CPU analysis.
After .cpuprofile file was generated, there are few possible ways to inspect it (more usage examples also available in cpupro official repo)
- Use cpupro npm package with npx to inspect
.cpuprofilelocally in browser, for example:
npx cpupro tramvai-cli.[timestamp].cpuprofile
This command will open a new window in your default browser, after this you can inspect your CPU profile. More options that you can use with cpupro npm package are described in official cpupro repository.
- Use a special viewer for CPU profiles - https://lahmatiy.github.io/cpupro/ and utilize a special drop zone to upload previously generated
.cpuprofilefile.
Results interpretation
On a Chart diagramm you can easily find heaviest functions calls. In our example, we have synthetically created a heavy React component, the rendering time of which took 30ms:
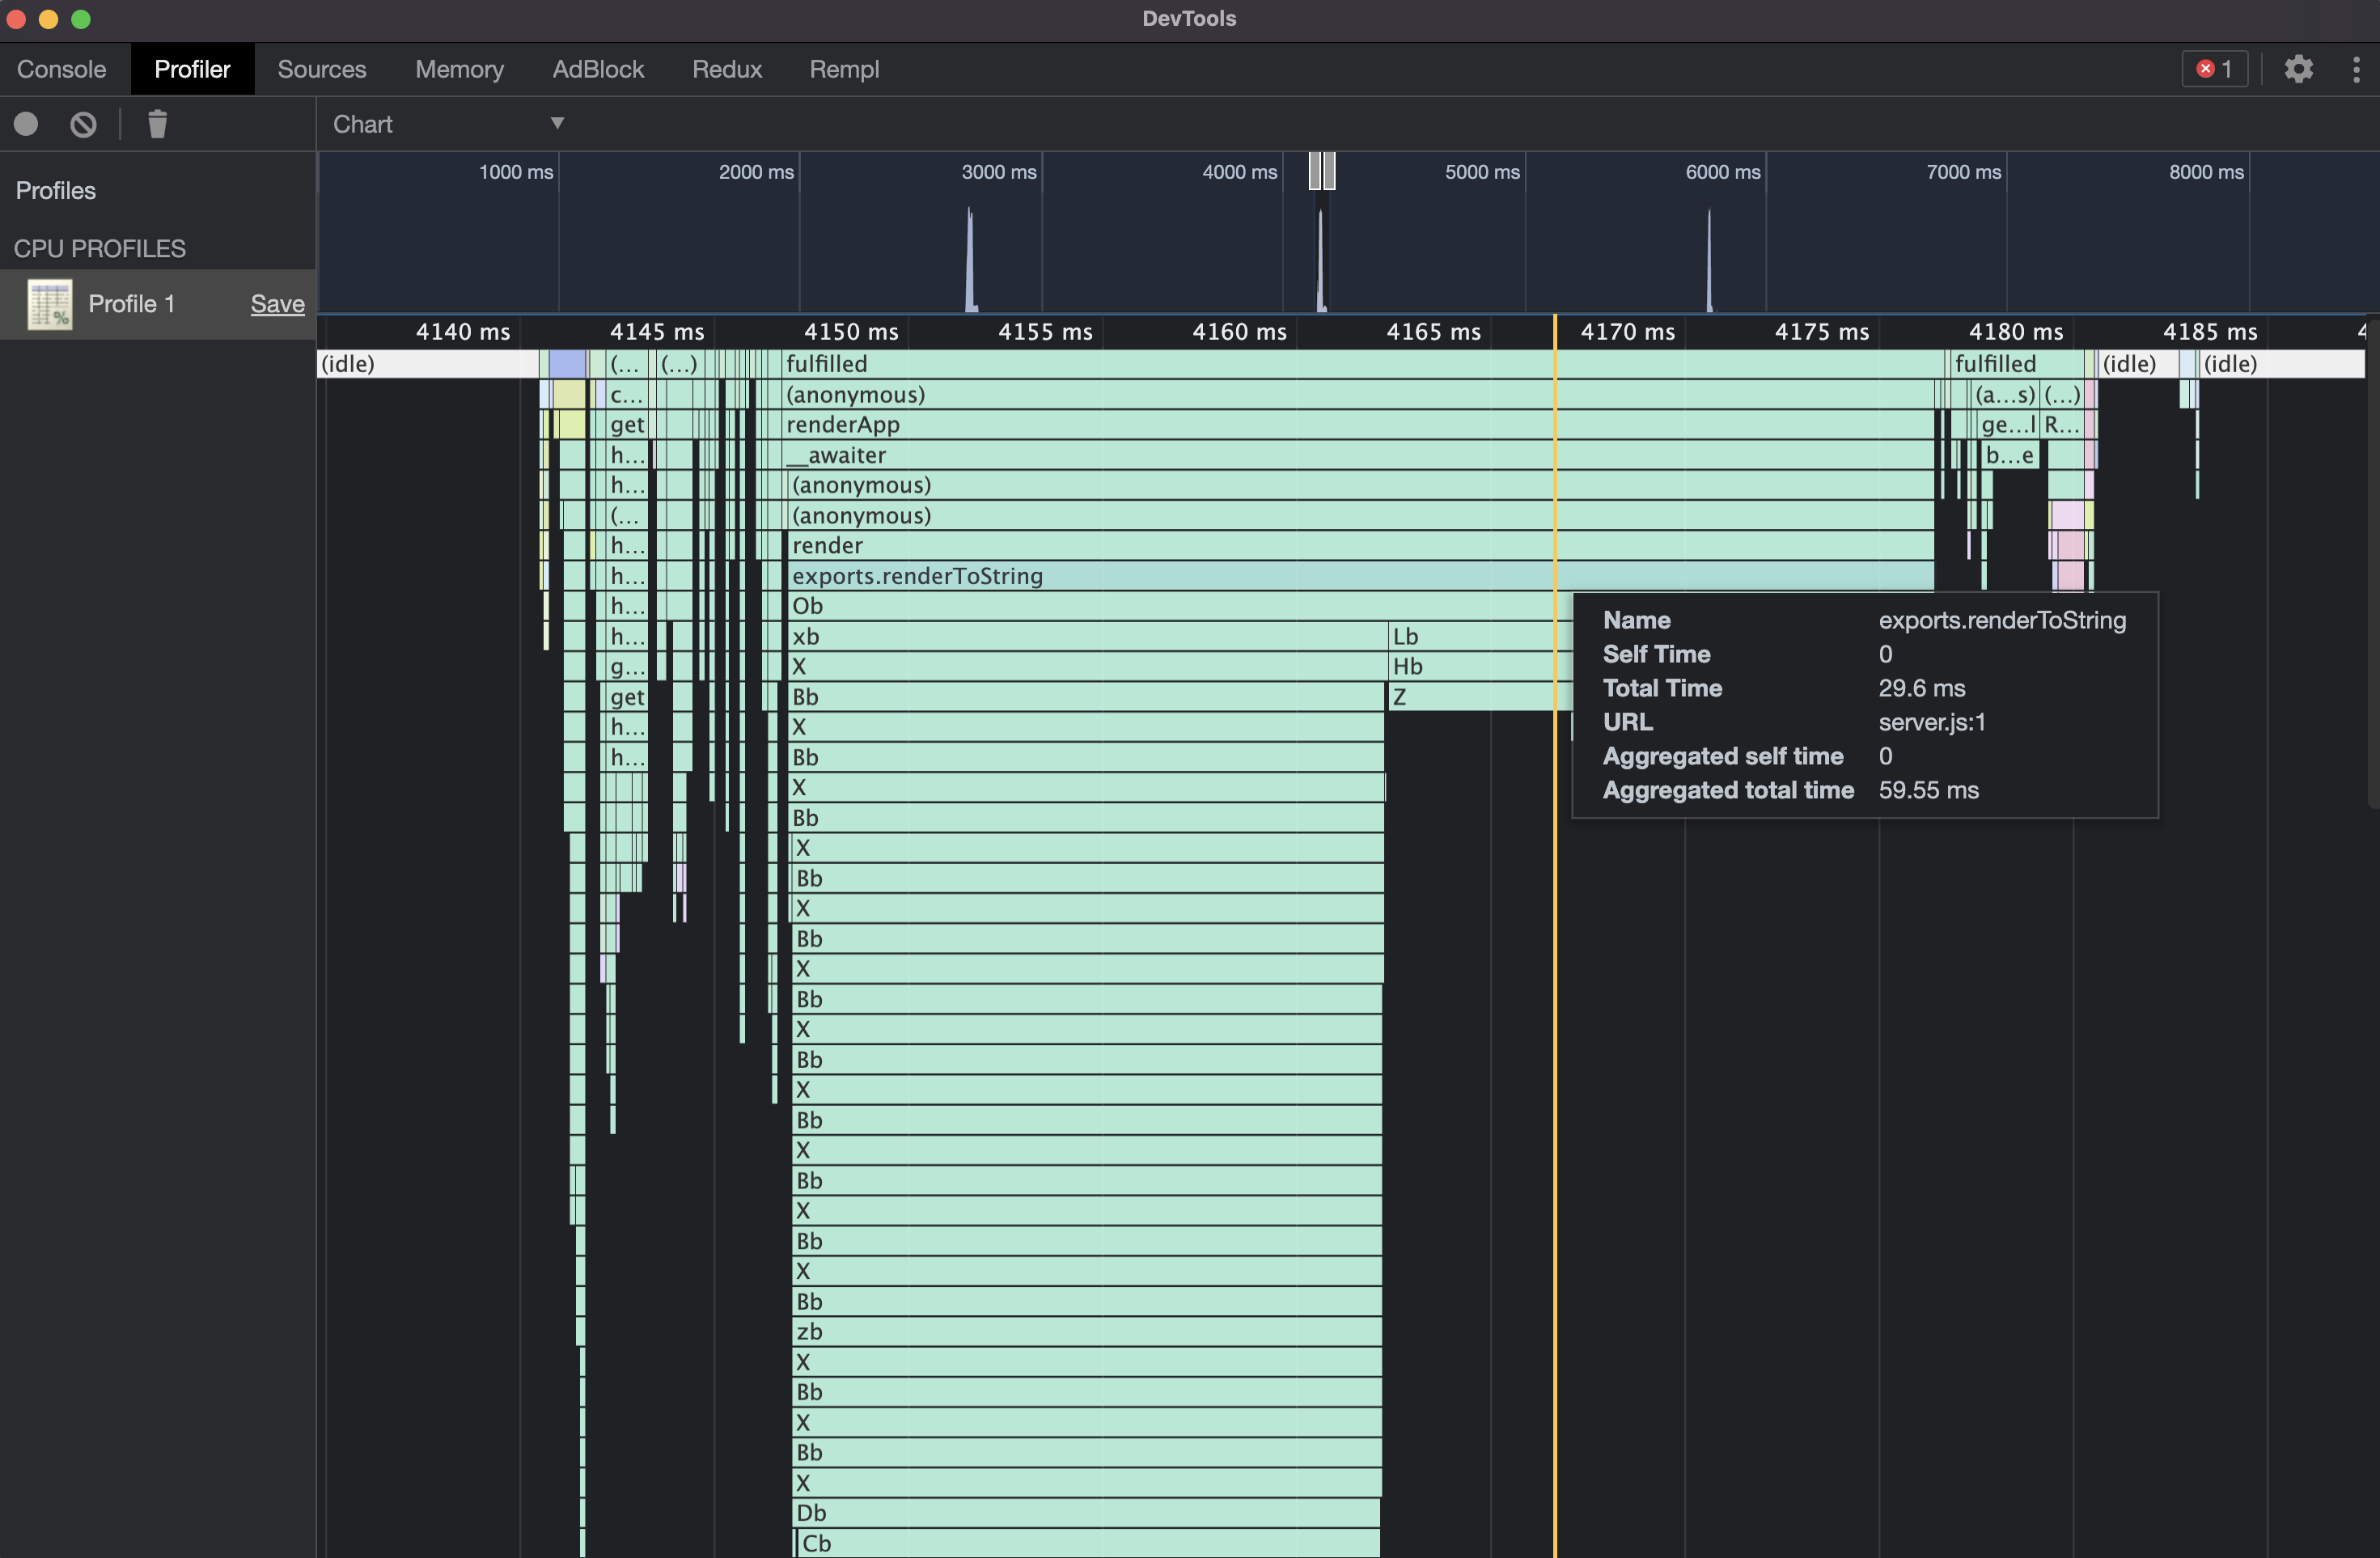
This is a really CPU-heavy task, and it's also likely to be much larger in your application than all the other tasks, called per single request.
We recommend paying attention to all tasks that run for more than a few milliseconds. Such tasks can be easily found in the Heavy table by looking at the Self Time column:
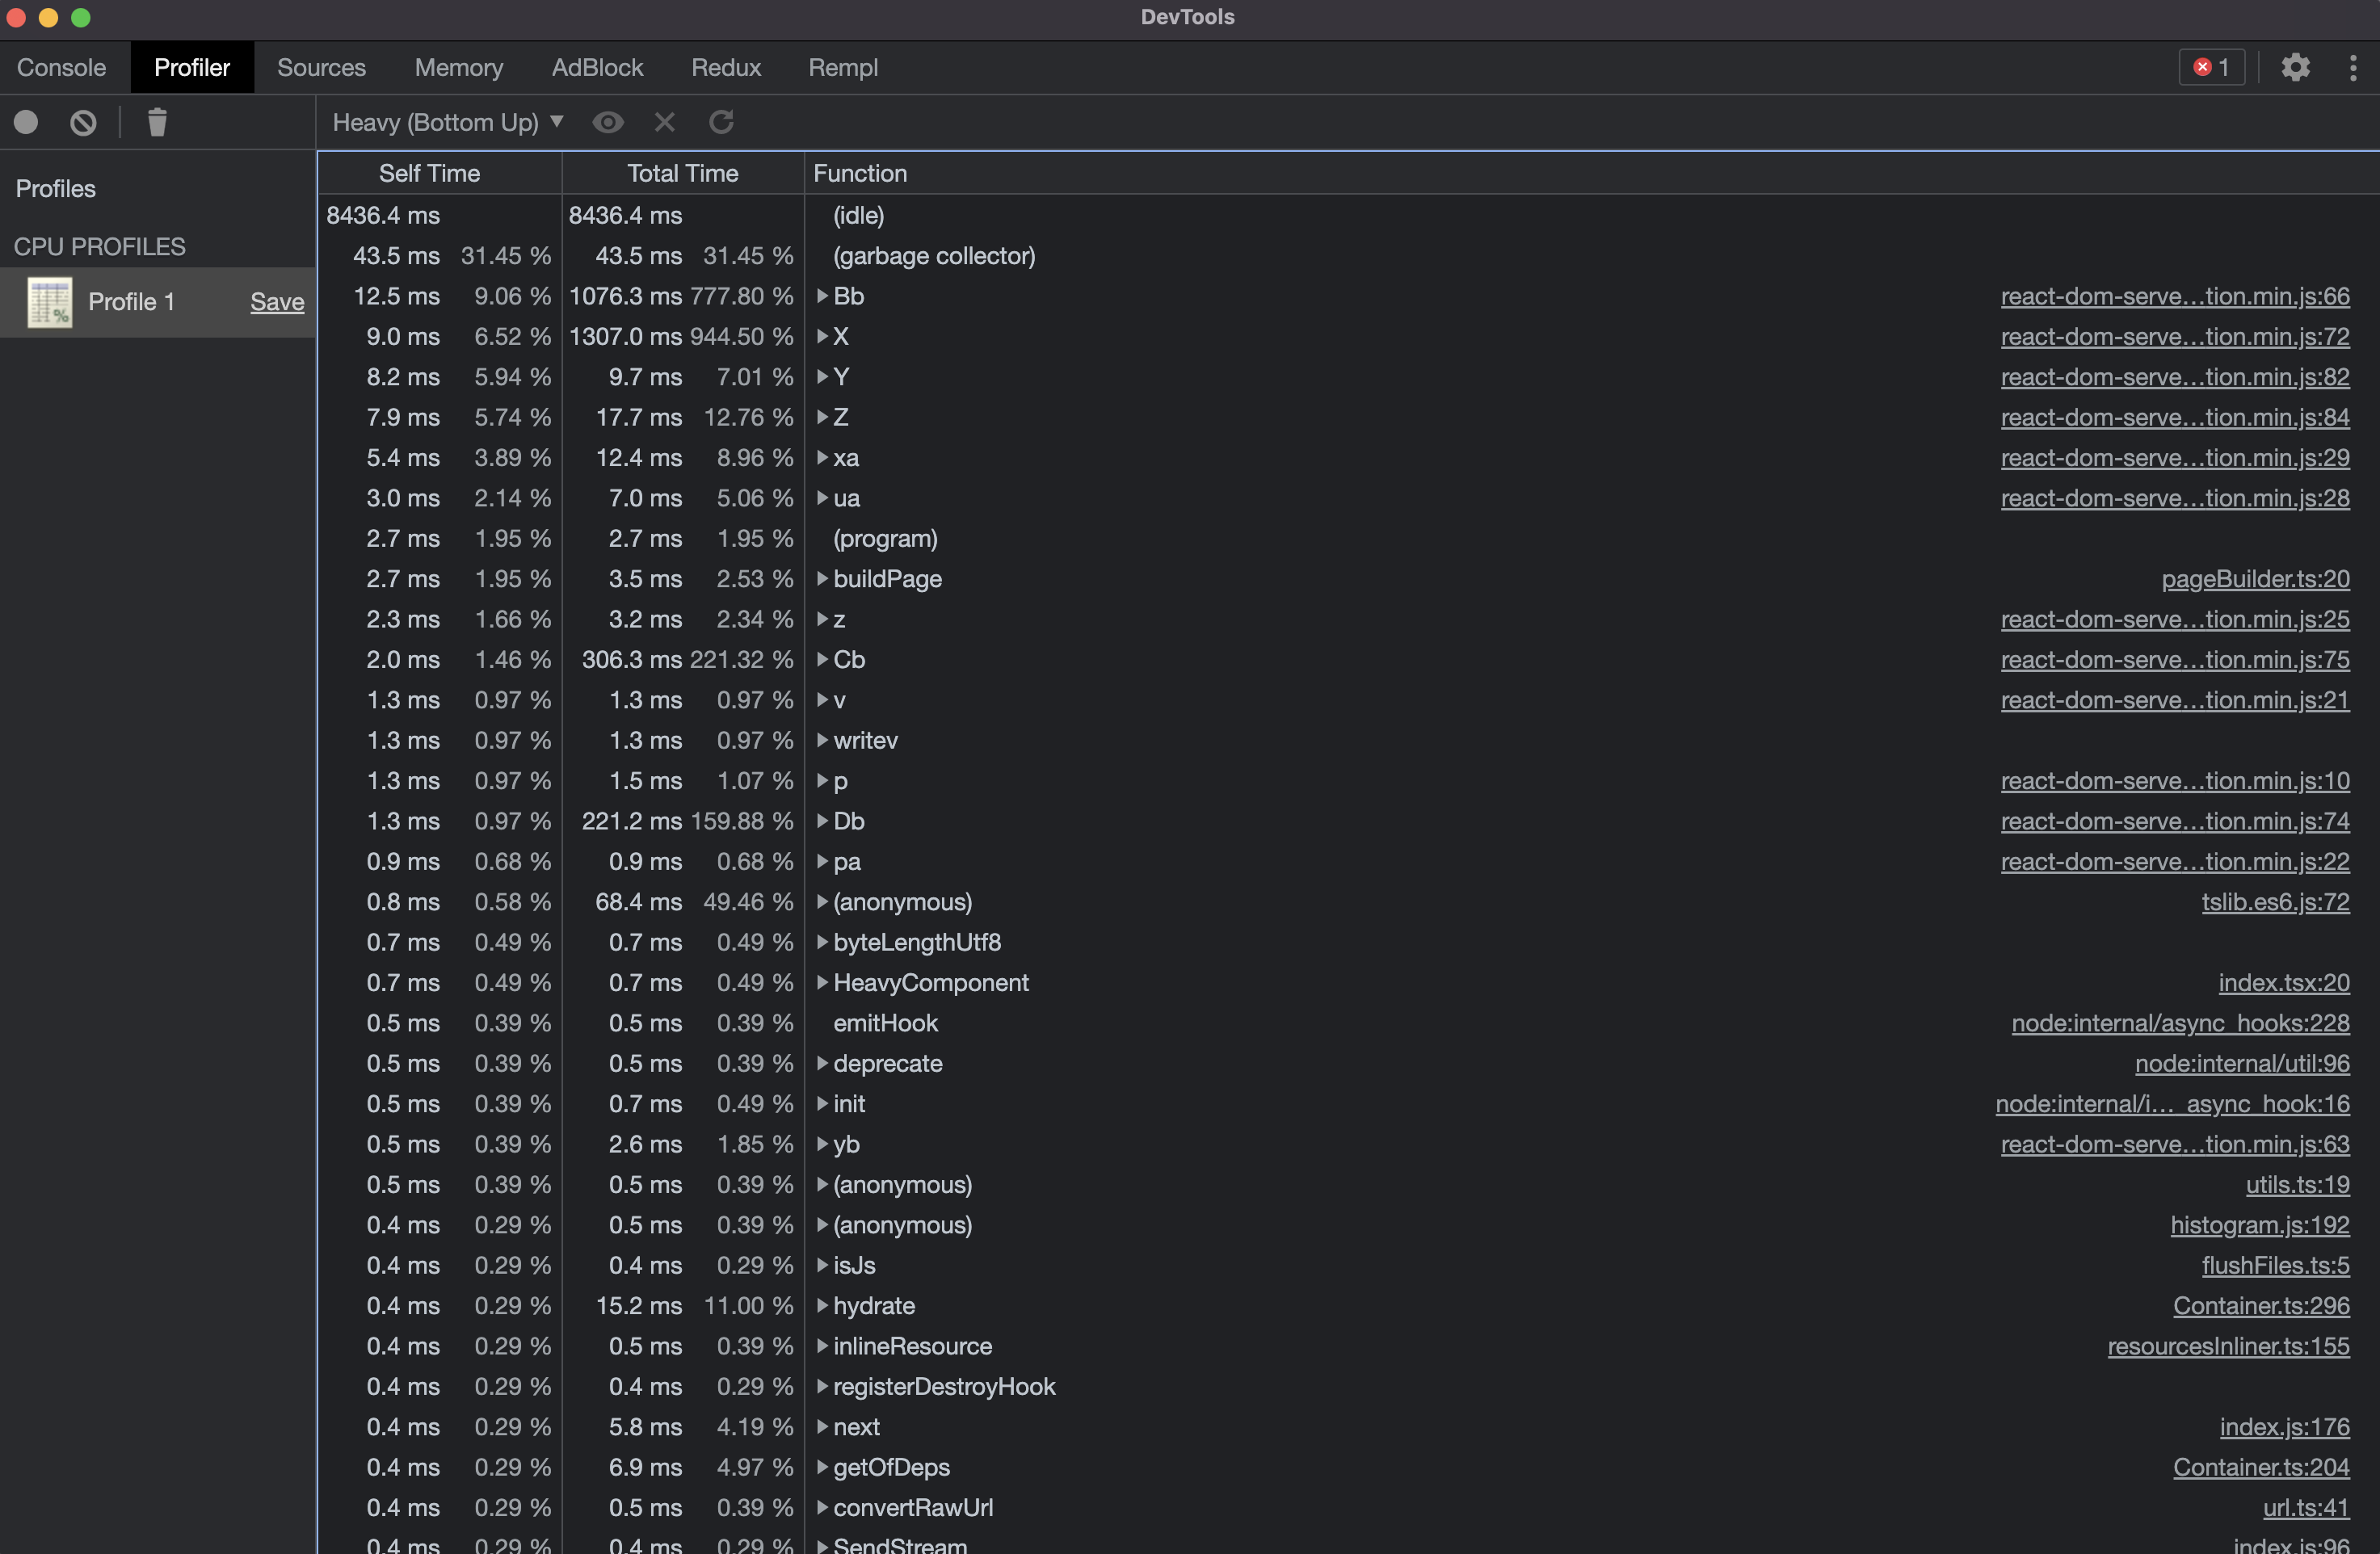
In this example, you can find a lot of internal React work, and one internal tramvai method call, larger than 2ms - buildPage. In the real application, you will definitely see a safeStringify method dehydrate near by, responsible for initial state serialization.
Share results
⌛ Press Save button on current CPU profile:
⌛ Pack the report in the archive, because it can be very heavy
Summary
In this guide we learned the basics of profiling tramvai applications. Each application has its own peculiarities, profiling different pages will give different results. It is important to understand what workloads your application is handling, what response timings you might consider good from the user's point of view, and to profile the rendering performance regularly. Every millisecond saved will have a positive impact on server health under continuous high loads.